Eight years ago I began to explore the application of process control in pig production, writes Stephen Hall of Stephen Hall Management. This followed a conversation with an uncle who’d spent his working life in engineering; he’d travelled the world involved in the management of quality control, and had studied and implemented the Japanese manufacturing concept of ‘total quality’. He knew nothing about pig production, but as we talked it became clear that it was worth exploring how the efficiency of the pig sector might be measured in similar ways to the processes involved in manufacturing.
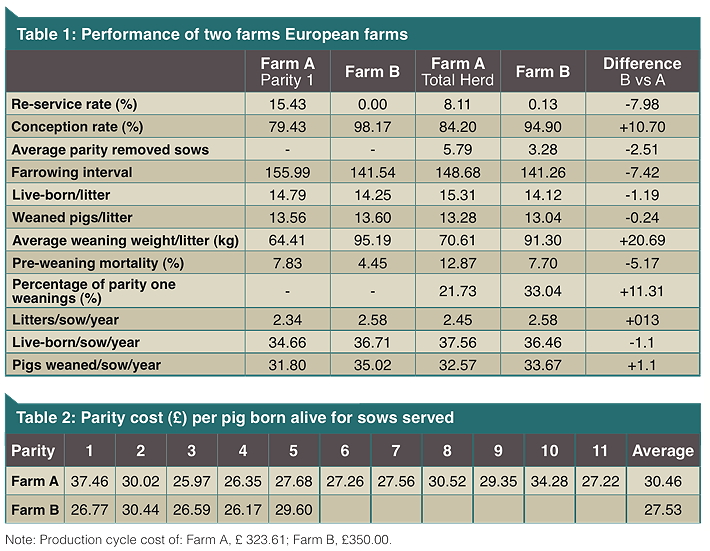
Table 1 shows the performance of two farms, Farm A and Farm B, both of which are commercial units in Europe – one from the UK. The first row of data indicates that Farm B is not serving gilts and sows that return. This is a strategy known as value engineering.
Producers reading may struggle to understand the value of this. The first two columns of data compare gilt (parity one) performance. Farm A is re-serving a high percentage of returns. The conception rate is comprised of the animals successfully served and the re-service rate indicates that several animals are being re-served multiple times, this means ‘old’ gilts eventually entering the breeding herd. This is keeping the eventual farrowing rate up where it is, yet it remains well below that of Farm B.
This highlights the need for a ‘total quality’ approach to gilt management. This approach is clearly being implemented at Farm B, as it’s culling all returns and achieving a farrowing rate of 98.17%. This high farrowing rate, in the absence of any re-service of returns, demonstrates what it’s possible to aspire to in terms of conception.
Producers purchasing parent gilts and their suppliers will understandably baulk at this. I have long argued that conception is a critical selection factor that has, historically, been overlooked in the pursuit of numbers, this is borne out by Farm A. The impact of the re-service rate on Farm A is a two-week difference in the farrowing index. That equates to almost 10% of the gilts never actually doing anything in Farm A except absorb cost.
Numbers born alive and weaned are competitive, but genetics play a part in the 1.19 pig difference. This is indicated by the variation in pre-weaning mortality percentage and consequently the numbers weaned, which close the gap to just 0.24 pigs losing 80% of the genetic gain through lactation.
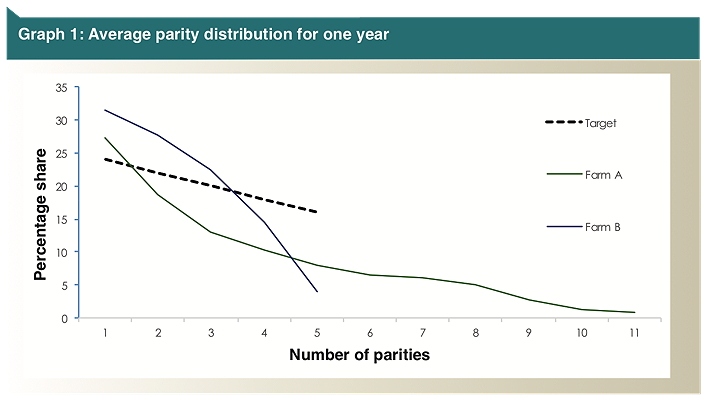
If you question this assumption, then look at the data row for ‘Average weaning weight/litter’. The difference here is significant, and to understand this you’ll need to study Graph 1. This shows the parity distribution of the two farms, reported as an average for a period of one year. Also shown is the target I set for the businesses that I work with.
Farm A is averaging eleven parities in production and Farm B five. The significant difference in overall litter weight can be due to a number of factors. Low weaning weights are being reported against the parity-one animals in Farm A. The poor reproductive management of the gilt in relation to conception could be further compromised by a corresponding poor management of lactation, producing a ‘light’ piglet at weaning.
It could just be that Farm A weans earlier than Farm B. If this is the case, then this factor is further propping up the comparative performance and, like for like, would make the difference in farrowing index greater and in real terms lower the output.
Either way these weaning weights will have a significant bearing on the cost efficiency of the feeding herd. Farm A has good genetics because of the numbers result they are getting despite poor gilt management that introduces a percentage of ‘old’ gilts into production, which immediately puts pressure on the number and quality of the overall herd output.
Financial value
To establish a relative financial value against the management practises of the two farms, I look at the difference between the number of piglets born alive to sows that record a farrowing within a service group, and then again at the number born alive to the total number of serves originally recorded against the sows in that service group. These are set against the average cost of a sow’s production cycle.
The purpose of this is simple as it demonstrates the reality of breeding herd performance in terms of cost. The average cost of a production cycle of the gilt and sow is something every producer and manager should know. This figure informs management ‘on the hoof’. For example, when standing by a freshly farrowed sow that has just delivered four stonking great piglets, it is worth calculating what they have cost. This is easy if you know the cost of the production cycle; if it’s £350, then these four cracking piglets have each cost the princely sum of £87.50. Management actions to record against the sow are: foster on surplus pigs (tick), cull at weaning (tick).
In Table 2, a cost of £350 is set against the production cycle for Farm B. This cost includes the total expenditure of the business divided by the number of completed production cycles in the period of that expenditure, including depreciation, imputed costs and valuation change. Farm A’s cost has been adjusted to allow for the difference in the rate, and therefore the cost, of breeding herd replacement.
The average number of pigs born alive per parity divided by the total number of serves made in that period, including the re-service rate and the farrowing rate, is then divided into that cost. In the column for parity one, the difference in cost per piglet born alive between Farm A and Farm B is minus £10.69. This is putting a value on the result of all that has been looked at in this article.
These financial values are a reference point to help understand how the points raised here relate to each other. Overall, Farm B with a management strategy of not serving returns, superior gilt management and a process control parity distribution of one to five produces piglets at almost £3.00 less than Farm A, which is also producing a smaller and potentially less-efficient feeding herd pig. This is despite the fact that Farm A is getting two-and-half more production cycles from the breeding females before culling.
For me, this supports a compelling argument that retaining failing animals within the business is not a viable proposition. Farm A will produce 3,257 weaned pigs and Farm B 3,367 weaned pigs per 100 breeding females. This amounts to a difference in output cost of £6,515 per 100 animals – that’s more than £30,000 for herds of 500-plus animals.
Weaker/lighter weaners could increase the cost of production by at least £7.00 per pig. The total difference between Farm A and Farm B could be at least £10.00 per slaughter pig in favour of Farm B.


